Following the publication of the proposals for the Victorian and WA redistributions, I put together two posts analysing different angles at a deeper level than the original analysis.
Rather than fully revisiting the topics, I thought I would just use one post to apply the same analysis to the NSW proposal, and also zoom out to the national level.
The two posts looked at how many seats were in each bracket of marginality prior to and after the redistribution, and how the old and new boundaries compare looking at results from 2004 to 2022.
Firstly, I’ve produced these charts that show how many seats have a particular margin on the two-party-preferred vote in the three redrawn states.
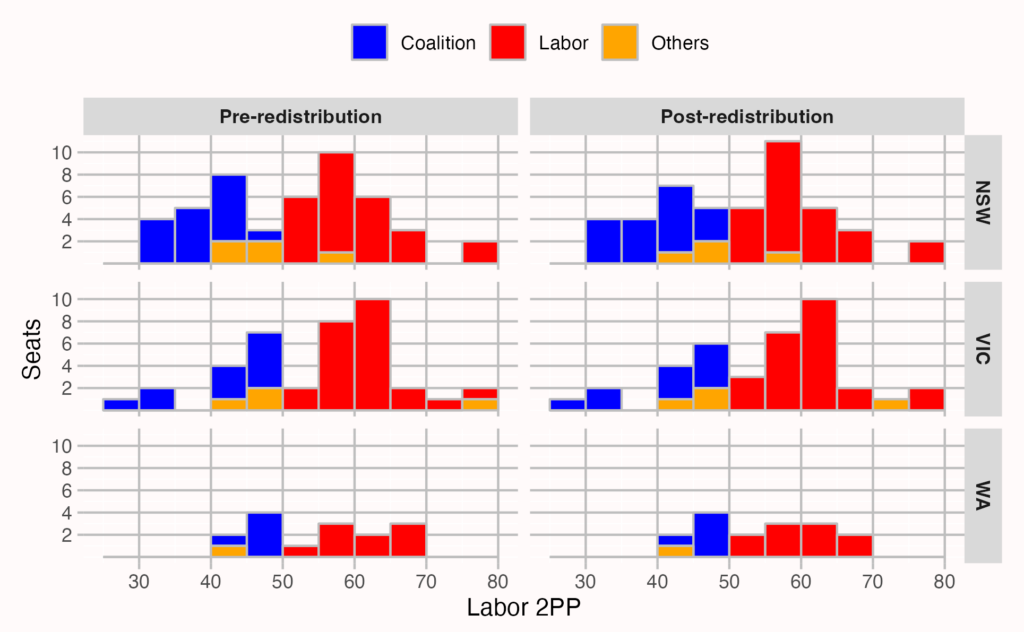
Coalition seats in NSW have on average become less marginal. There is one less seat in the 60-65% range and one less seat in the 55-60% range. These seats haven’t been abolished, but have instead appeared in the 50-55% range. Prior to the redistribution, there were three seats with a Coalition 2PP in the 50-55% range, two of which were won by independents – Warringah and North Sydney. After the redistribution, there were five. Again, two of them are held by independents. North Sydney was abolished, but Wentworth became stronger for Labor on the 2PP and entered that range.
Labor lost one seat, which is reflected in their reduced number in the 50-55% range. Their remaining seats are a bit less safe, with one seat moving from 60-65% to 55-60% range.
Now that we have redistributions for the three big states, I’ve also done a similar chart for the whole country.
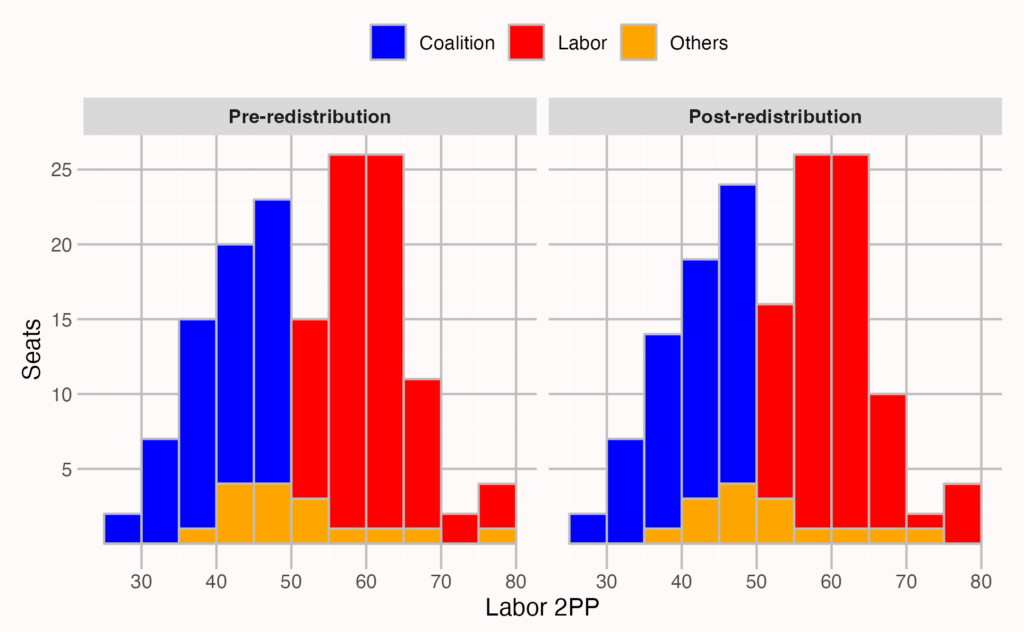
Coalition seats generally became less safe, with one seat moving from the 60-65% range to the 50-55% range. The same is also true on the Labor side, with one less seat at 65-70% and one more at 50-55%.
Next up, I’ve converted the results from all federal elections from 2004 to 2022 to the new proposed boundaries for NSW. At the end of the post I’ve listed every NSW seat with the actual 2019 result and the 2019 result for the new boundaries.
For this next chart, I show my estimate of the Labor 2PP in a selection of seats both for the 2022 version of electorates, and the 2025 version. I’ve now also added a third line to show the actual outcomes at each election.
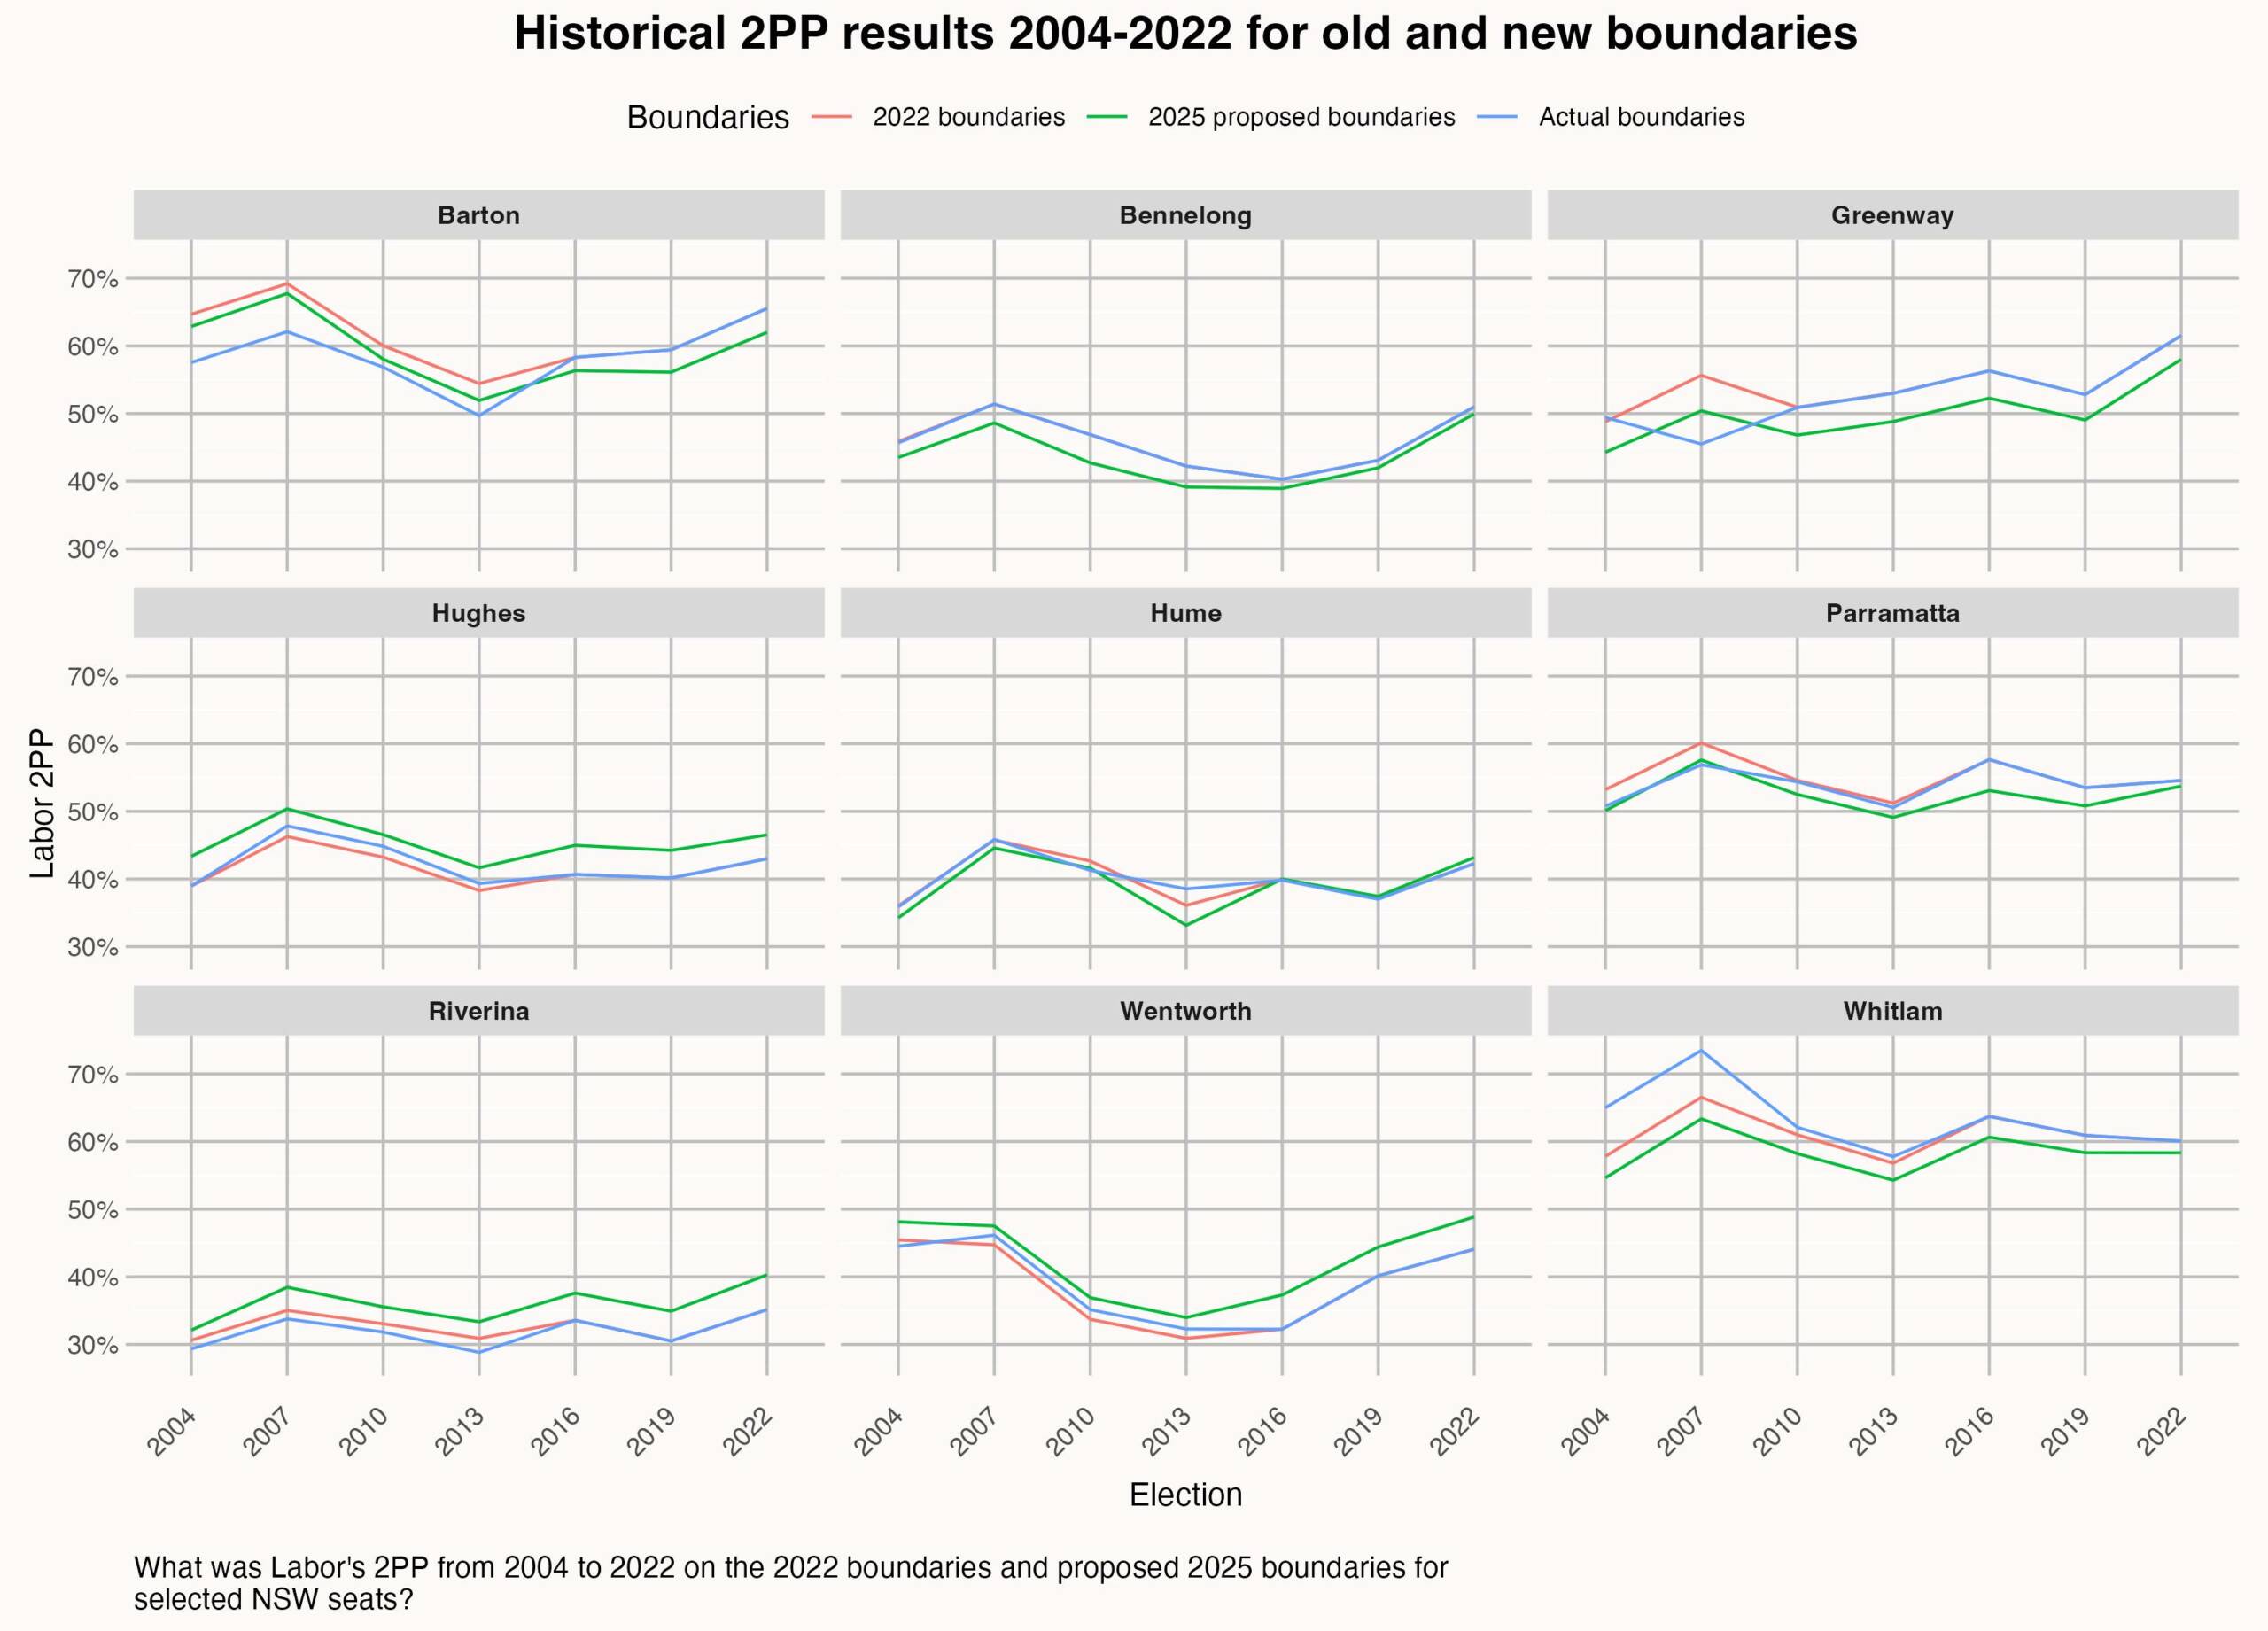
These aren’t the most intuitive graphs but when you pay attention they have an interesting story. When the blue and red lines have diverged, that indicates a previous change in a seat’s political make-up. When the green line diverges from the other lines, that indicates a change between 2022 and 2025.
The proposed boundaries in Barton are consistently worse for Labor than the 2022 boundaries, it’s not as favourable to the Liberal Party as the previous boundaries used from 2004 (or earlier) until 2013, which led to the Liberal Party winning narrowly in 2013. On the proposed boundaries, Labor would have held on in that year.
Bennelong has experienced no boundary changes since 2006, and the 2001-2004 boundaries were only subtly different, so you see no difference on my chart between the actual result and the 2022 boundaries result. It’s interesting to see how the proposed new boundaries would have always been more favourable for the Liberal Party, but the size of that gap has varied over time. It was biggest in 2010, when an incumbent Labor MP was up for election in the actual Bennelong but obviously not in the newly-added suburbs. Perhaps an encouraging sign for the local member.
Greenway’s 2022 boundaries have produced a very similar outcome as all boundaries since 2010, but the 2007 boundaries were dramatically different, with the entire Hawkesbury region added to the seat. The 2004 boundaries covered most of the current area, plus some more of the Blacktown LGA, and thus produced similar results. The proposed changes would have made the Liberal position about 4-5% stronger at any point in the last 20 years compared to the 2022 boundaries.
The new boundaries for Hughes would have narrowly elected Labor in 2007. The last redistribution in 2016 made Hughes slightly better for the Liberal Party, but the proposed boundaries have a much bigger impact in the opposite direction.
It is amazing to see how little difference there is in the seat of Hume despite the seat changing so much, both compared to its 2022 boundaries and its boundaries in earlier eras. The only exception is in 2013, when the ALP would have done much worse in the new Macarthur-based seat than the current boundaries, and even that was worse than the actual outcome in 2013, when the seat was much less urban than the 2022 version.
The gap between the Parramatta result on the old and new boundaries is relatively consistent, although the gap was much smaller for the 2022 results. This would likely reflect the Labor vote being relatively stronger in Bennelong in 2022 than in previous elections, when compared to Parramatta. It may also reflect that Andrew Charlton did relatively better in the north-east of Parramatta and less well in some of the areas lost from the seat. Interestingly, the proposed Parramatta looks a lot similar to the 2004-2007 version when Julie Owens was first winning, but the 2009 redistribution strengthened Labor’s position.
It looks like the gap between the Riverina margin on the 2022 and proposed 2025 boundaries has been widening.
Likewise the gap in Wentworth has been widening, although the 2007-2013 versions of Wentworth were about halfway between the 2022 and 2025 versions.
Finally Whitlam is an interesting seat, with the proposed boundaries consistently worse than the 2022 boundaries, but the shift is much less dramatic than what we saw in 2009 when the former seat of Throsby was first expanded into the Southern Highlands.
In the process of making this chart I also developed a second chart which shows the gap between each metric, rather than the total 2PP. This chart shows 16 seats in all three redistributed states: blue shows the gap between the proposed 2025 boundaries and the actual result, and red shows the gap between the proposed 2025 and 2022 boundaries.
This shows up some fascinating trends more clearly, such as:
- Bennelong – Labor is disadvantaged by the changed boundaries, but would have fared much worse if this change was made prior to 2016.
- Chisholm – the Labor disadvantage from the last redistribution would have been worth about 3-4%, but that’s only about half as much Labor disadvantage they’ve accumulated since the 2007-2013 version.
- Dunkley – the recent change was quite subtle, although it would’ve been worse in past years, and is much less significant than the 2018 change.
- Hotham – Labor’s position has been made about 3-5% worse, but the Labor position is now similar to their actual result prior to the 2021 redistribution.
- Hume – This change would’ve helped the Liberal Party at any point up to 2013, but is now very slightly helpful to Labor.
- Menzies – While this seat flipped from Liberal to Labor, the change was much more subtle than previous changes.
- Wentworth – The Labor 2PP is boosted by about 5%, and it would’ve been similar on the 2016 or 2019 results, but before that election it would’ve only been worth about 3%.
And finally, as promised here is the full list of 2019 results by proposed seat.
Seat
2019-2022 map
2025 map
Banks
LIB 6.3%
LIB 5.7%
Barton
ALP 9.4%
ALP 6.1%
Bennelong
LIB 6.9%
LIB 8%
Berowra
LIB 15.7%
LIB 13.8%
Blaxland
ALP 14.7%
ALP 12%
Bradfield
LIB 16.6%
LIB 15.7%
Calare
NAT 13.3%
NAT 13.3%
Chifley
ALP 12.4%
ALP 12.7%
Cook
LIB 19%
LIB 17.6%
Cowper
NAT 11.9%
NAT 11.9%
Cunningham
ALP 13.4%
ALP 14.1%
Dobell
ALP 1.5%
ALP 1.5%
Eden-Monaro
ALP 0.8%
LIB 0.7%
Farrer
LIB 19.8%
LIB 19.8%
Fowler
ALP 14%
ALP 13.6%
Gilmore
ALP 2.6%
ALP 2.6%
Grayndler
ALP 23.8%
ALP 22.2%
Greenway
ALP 2.8%
LIB 1%
Hughes
LIB 9.9%
LIB 5.8%
Hume
LIB 12.9%
LIB 12.6%
Hunter
ALP 3%
ALP 4%
Kingsford Smith
ALP 8.8%
ALP 7.7%
Lindsay
LIB 5.1%
LIB 4.7%
Lyne
NAT 15.2%
NAT 15.2%
Macarthur
ALP 8.4%
ALP 10.2%
Mackellar
LIB 13.2%
LIB 12.2%
Macquarie
ALP 0.2%
LIB 0.6%
McMahon
ALP 6.6%
ALP 7.3%
Mitchell
LIB 18.6%
LIB 18.4%
New England
NAT 17.6%
NAT 16.3%
Newcastle
ALP 13.8%
ALP 13.8%
North Sydney
LIB 9.3%
Page
NAT 9.4%
NAT 9.4%
Parkes
NAT 16.9%
NAT 17.9%
Parramatta
ALP 3.5%
ALP 0.8%
Paterson
ALP 5%
ALP 4.2%
Reid
LIB 3.1%
LIB 3.1%
Richmond
ALP 4.1%
ALP 4%
Riverina
NAT 19.5%
NAT 15.1%
Robertson
LIB 4.2%
LIB 4.2%
Shortland
ALP 4.5%
ALP 4.7%
Sydney
ALP 18.7%
ALP 18.8%
Warringah
LIB 2.1%
LIB 3.4%
Watson
ALP 13.5%
ALP 14.9%
Wentworth
LIB 9.9%
LIB 5.6%
Werriwa
ALP 5.5%
ALP 5.3%
Whitlam
ALP 10.9%
ALP 8.3%