From one election to the next, the swings back and forth of Australian politics can look cyclical – that things start and end in the same place. But when you widen the time frame, things look different. Over time, some place move from being safe seats to marginal seats, or even from being safe seats for one major party to the other major party.
Back in 2022 I published data that I produced converting federal election results since 2004 into modern electoral boundaries. I have now converted that data to the 2025 boundaries, and added the 2022 election results. That’s seven elections worth of data that is comparable in a way you can’t do with standard election results, due to the impact of redistributions. Throughout this blog post, all references to electorates will be based on the current 2025 boundaries.
With two-party-preferred votes, you can rank every seat in the country from 1 to 150, which makes it possible to compare different elections where the country as a whole may have been leaning more towards Labor or towards the Coalition. For this post I am most interested in seats that have shifted one way or the other, and particularly seats that have moved in or out of the group of seats that decide elections, primarily comparing the elections where Labor came into government: 2007 and 2022.
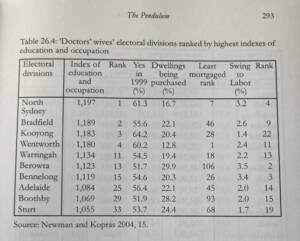
When I compare the 2022 results to previous elections, unsurprisingly I find the correlations weaker as I go further back in time, but actually 2007 is more unlike 2022 than 2004 is. 2004 was an election where Labor gained ground in the inner cities while losing ground elsewhere. It was the election that coined the term “doctors wives”. Indeed while reading the 2004 book Mortgage Nation I came across this table from Malcolm Mackerras. Most of the seats on this list have been lost for the Liberal Party, many of them to teals.
The 2007 election had a Labor 2PP of 52.7%, while 2022 had a Labor 2PP of 52.1%. Both elections saw the election of a first-term Labor government. In 2007, Labor won 83 seats on the 2PP. In 2022, Labor won 77 seats, plus seven crossbench seats had a Labor 2PP majority, which adds up to 84 seats. While there were major differences, the two elections are very comparable.
I will post maps below showing how much each seat shifted between 2007 and 2022, but first this chart shows the rank of every seat on the 2PP in 2007 and 2022.
Seats in red have changed their rank in Labor’s favour over these 15 years. Seats in blue have shifted towards the Coalition. Overall 71 seats have moved towards the Coalition and 79 towards Labor. The black diagonal line indicates where every seat would be if they kept their rank, so seats close to this line haven’t moved much. If you’re closer to the top left corner or bottom right corner, the seat has moved a lot.
The horizontal and vertical lines mark out the seats that ranked between 66 and 85 in each of these elections: the seats that decide the election. Amazingly, only one seat was in both lists: McEwen, in Victoria. That seat was Labor’s 82nd best seat in 2007 and is now 71st-best, on the 2025 boundaries.
The seat that has shifted the most towards the Coalition is Capricornia. This seat was a safe Labor seat in 2007 but is now a safe LNP seat. It moved 82 places over those 15 years. On the other hand, Pearce in Western Australia has moved 69 places. Capricornia has shifted gradually but most of Pearce’s change happened in one election. The seat was ranked 120th in 2007, was ranked between 86 and 99 from 2013 to 2019, but then dropped to 51st in 2022. Capricornia’s change seems more likely to be permanent, while Pearce may well fall back into the pack.
In terms of marginal seats, Kingston, Perth, Franklin and Burt were all in the 20 most marginal seats in 2007 but are now amongst Labor’s 21 safest seats. Page, Dawson and Braddon were also in that cluster of important seats but are now amongst the Coalition’s 31 safest seats.
Hunter, Fowler and Werriwa were all amongst Labor’s 22 safest seats in 2007, but are now close to or in the 20 most important seats. Mayo, Bullwinkel and Tangney were all amongst the Coalition’s 36 safest seats but are now in the key 20 seats.
When you look at seats by their regional classification, quite a lot has changed. When you split the country into Labor’s 75 best seats and the Coalition’s 75 best seats, Labor has made a net gain of 3 seats in inner metro areas, and a net gain of two in outer metro areas. The Coalition has had a net gain of one in provincial areas and four in rural areas. Over just 15 years, it is possible to identify the urban-rural trend which has defined the last century. Labor improved their position in 29 out of 43 inner metropolitan seats, while the Coalition improved their position in 22 out of 38 rural seats.
Finally, this map shows the relative shift in ranks for each seat from 2007 to 2022. If you click on a seat you can see my estimate of the 2PP for 2025 boundaries for all elections back to 2004.
Broader trends become obvious on the map. WA in general has shifted strongly towards Labor, while Queensland has mostly shifted to Labor. The south of Tasmania is more pro-Labor while the north is more pro-Liberal. In the south-eastern states, cities have moved to the left while rural areas have moved to the right. But there are exceptions in the cities – the south-west of Sydney and the west of Melbourne are substantially more friendly to the Liberals than they were in 2007.
This story doesn’t end in 2022, and it will be interesting to see which seats will swing more strongly in 2025. The marginal seats of tomorrow will not be the same as the marginal seats of the past.